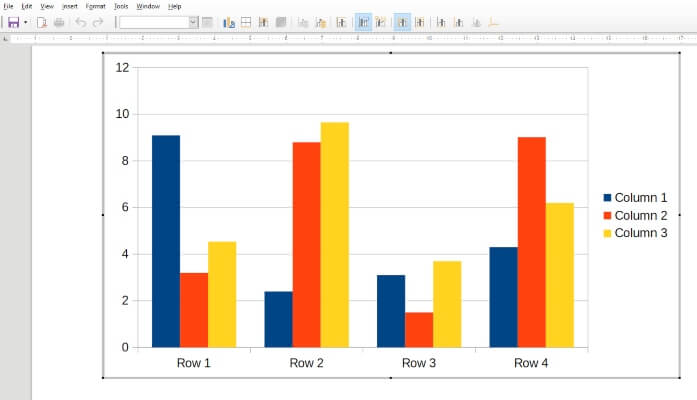
LibreOffice Charts is an open-source chart creation module a part of LibreOffice’s office suite. Charts let you create and embed pie charts, square and round columns, trend graphs, dots, 2D and 3D charts, etc., and control their style, color, and size.