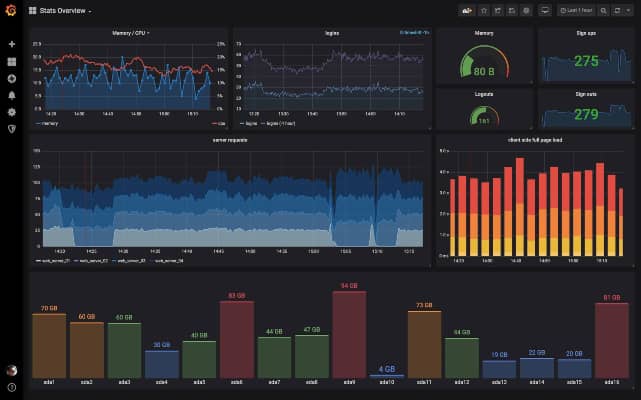
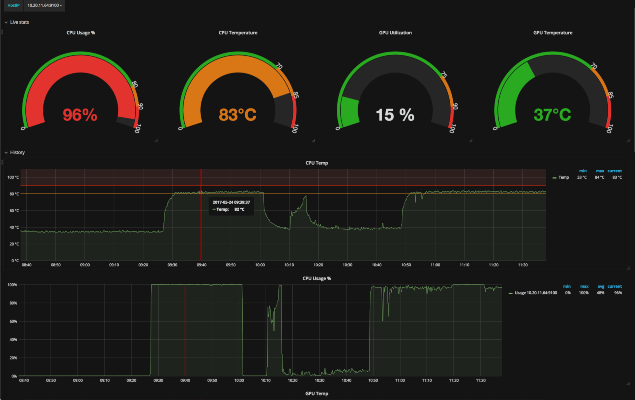
Grafana is a multi-platform open-source analytics and interactive visualization web application. It provides charts, graphs, and alerts for the web when connected to supported data sources.
Related Tools
Prometheus
Prometheus is an open-source software application used for event monitoring and alerting. It records metrics in a time series database built using an HTTP pull model, with flexible queries and real-time alerting.
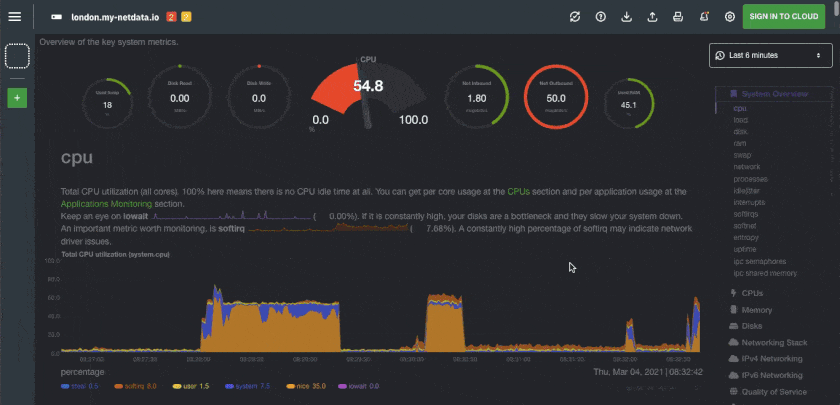
Netdata
Netdata is a distributed, real-time, performance, and health monitoring platform for systems, hardware, containers, and applications, collecting thousands of useful metrics with zero configuration needed.
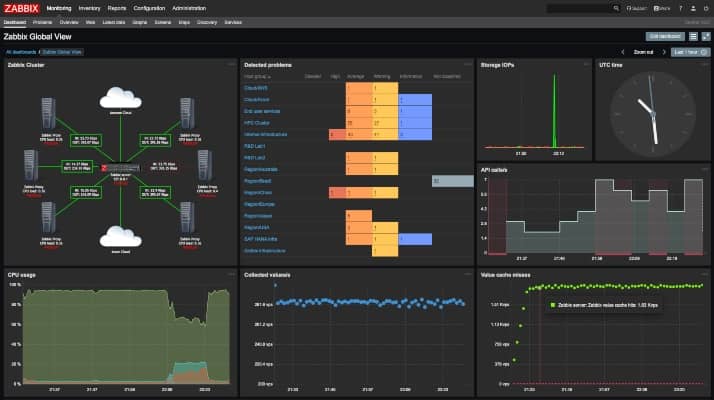
Zabbix
Zabbix is an open-source monitoring software tool for various IT components, including networks, servers, applications, databases, virtual machines, and cloud services.
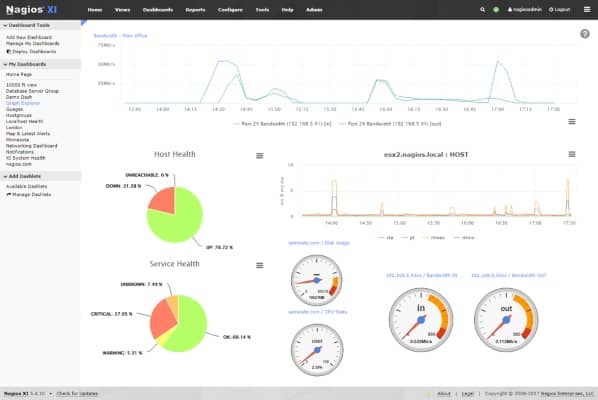
Nagios
Nagios is an open-source network monitoring for Linux, Windows, and Unix that help monitor network for problems caused by overloaded data links or network connections and monitoring routers, switches, and more.
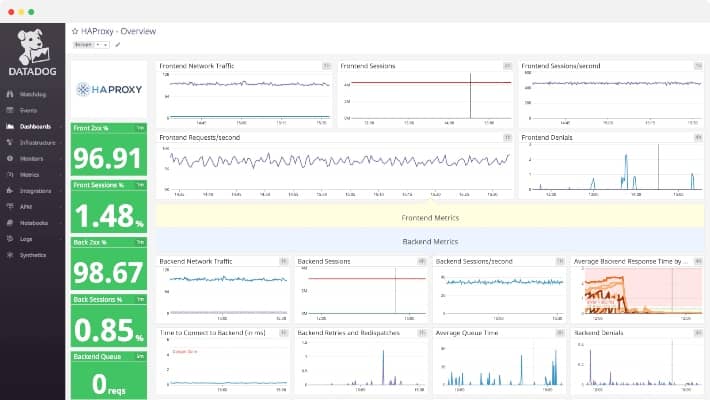
Datadog
Datadog is a monitoring and analytics tool that focus on infrastructure monitoring and cloud services that cover all relevant infrastructure monitoring parameters (metrics, logs, security, etc.).