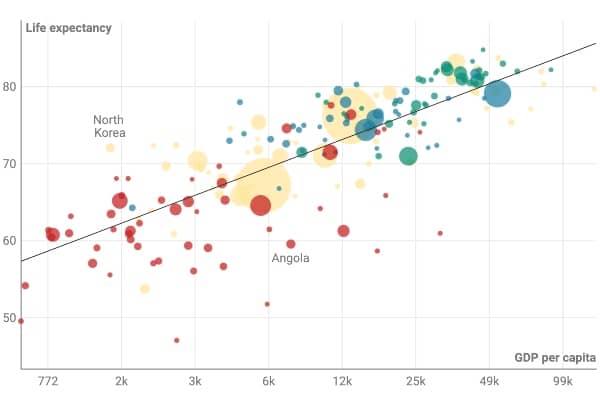
Datawrapper is a data visualization tool that creates charts, maps, and tables to help better tell your story by copying and past your data from the web, Excel, Google Sheets, or CSV/XLS files.
More Details
Datawrapper’s free plan lets you create and publish unlimited charts, maps & tables and export them only as a PNG file. Note that all the visualization created with the free plan contains a subtle “Created With Datawrapper” attribution in the footer.
Related Tools
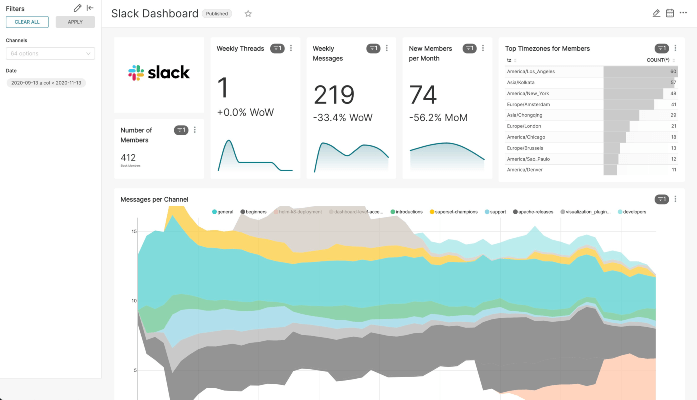
Superset
Superset is a modern data exploration and visualization platform that can replace or augment proprietary business intelligence tools for many teams. Superset integrates well with a variety of data sources.
Map Image
Map Image is an online tool allowing creat customize static map images. Select a location, add markers, choose a map style, add labels, logos, and more. You can download the map as a high-resolution image.
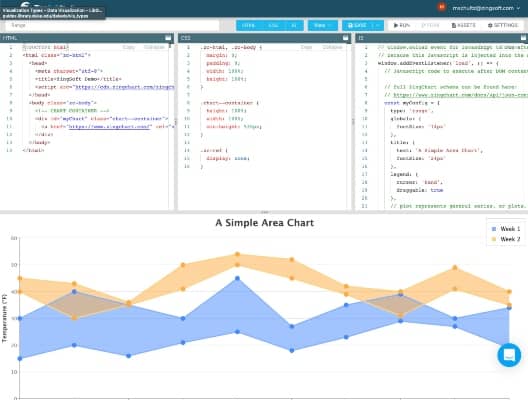
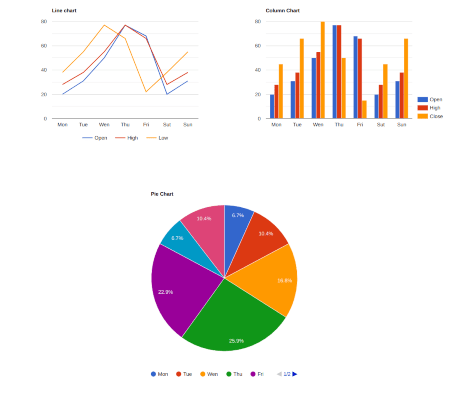
ZingChart
ZingChart is an open-source JavaScript library for building interactive and intuitive Charts for showing various data elements. It's dependency-free with no need for third-party frameworks or plugins.
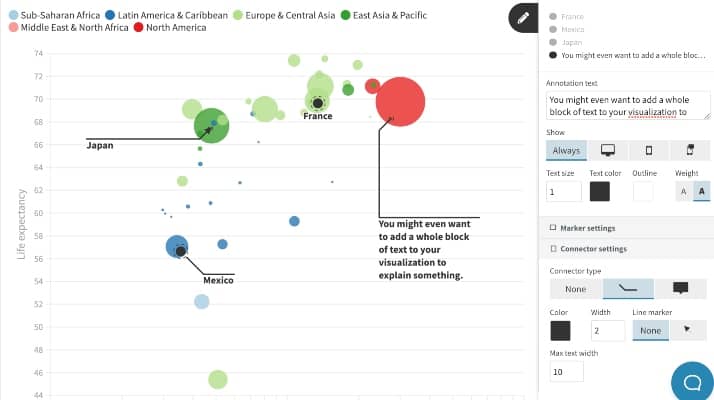
Flourish
Flourish is a user-friendly data visualization platform to create powerful interactive data stories. Flourish can be used to scale and manage any interactive content, and developers can easily add bespoke private templates to the account.
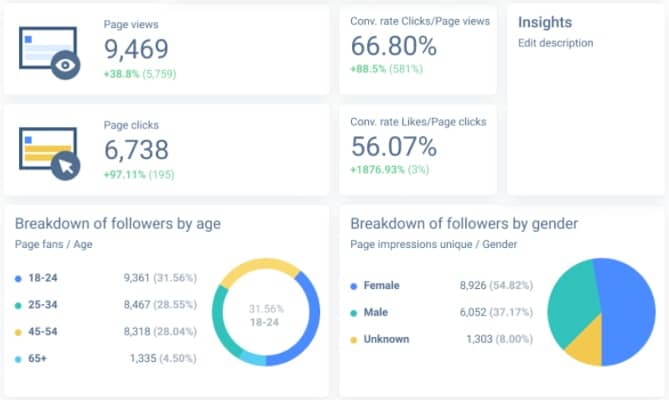
Whatagraph
Whatagraph is an online platform used by marketing agencies, in-house marketing departments, and freelancers to review, monitor, and report on the performance of their marketing campaigns.
wpDataTables
wpDataTables is a WordPress table plugin used to create tables and table charts from Excel quickly, CSV, PHP, and other data sources.